Research Question 3: Taker Orders
Summary
- I measured taker orders' activity by it'S aggregated unrealized profit, volume and profitability of their position at maturity on each tick
- Products that I analyzed are Nikkei 225, TOPIX and Japanese Government Bond Future; For Nikkei 225 and TOPIX, mini variant included with appropriate weight.
- I grouped each data points by how the market moved in next 3600 seconds.
- Statistical summary reveals that underlying distribution of data points are different prior to market move
Visualized Overview of Generated Data
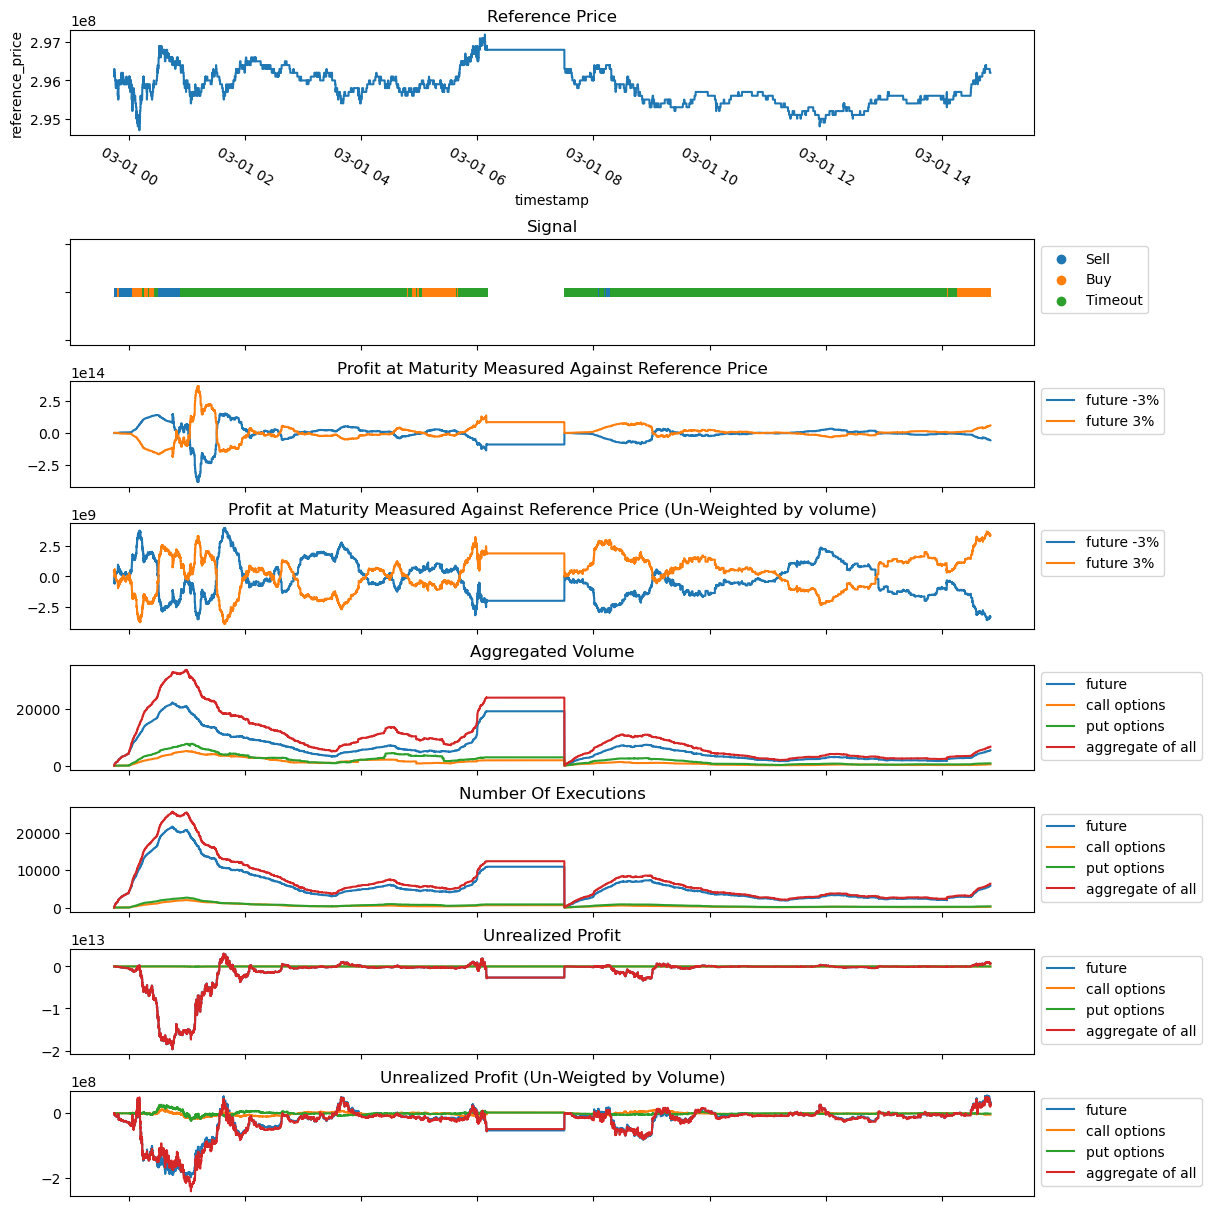
Below plot is the visualization of generated data.
-
Reference Price
Reference price tracks the execution price of the future contract. -
Signal
This is a categorical value that takes one of 3 value.
Value Condition Buy If you buythe contract atask price, you can turnXpoint of profit by selling atbid pricein next3600 secondsSell If you sellthe contract atbid price, you can turnXpoint of profit by selling atask pricein next3600 secondsTimeout None of the condition were met. -
Profit at Maturity Measured Against Reference Price
This tracks taker's profit at maturity, it uses reference price as hypothetical final settlement price.Say, in last
Tseconds, we observed following transactions.Product Taker's Side Quantity Strike Price Transaction Price Transaction Time Future Buy 10 --- 19,900 10:00 Mini Future Sell 10 --- 20,100 11:00 Call option Buy 10 20,000 500 10:30 Put option Sell 10 20,000 300 10:25 When the reference price is 20,000JPY, value at maturity would be,
Moneyness Future Mini Future Call option Put option -3% (19,400) -5,000 700 -5,000 -3,000 -2%(19,600) -3,000 500 -5,000 -1,000 -1%(19,800) -1,000 300 -5,000 1,000 0%(20,000) 1,000 100 -5,000 3,000 1%(20,200) 3,000 -100 -3,000 3,000 2%(20,400) 5,000 -300 -1,000 3,000 3%(20,600) 7,000 -500 1,000 3,000 -
Profit at Maturity Measured Against Reference Price un-weigted by volume
Say, in last
Tseconds, we observed following transactions (same as the previous example).Product Taker's Side Quantity Strike Price Transaction Price Transaction Time Future Buy 10 --- 19,900 10:00 Mini Future Sell 10 --- 20,100 11:00 Call option Buy 10 20,000 500 10:30 Put option Sell 10 20,000 300 10:25 When the reference price is 20,000JPY, value at maturity would be,
Moneyness Future Mini Future Call option Put option -3% (19,400) -500 70 -500 -300 -2%(19,600) -300 50 -500 -100 -1%(19,800) -100 30 -500 100 0%(20,000) 100 10 -500 300 1%(20,200) 300 -10 -300 300 2%(20,400) 500 -30 -100 300 3%(20,600) 700 -50 100 300 -
Aggregated volume
This is the aggregated volume within a time window.
-
Number of executions
This tracks the number of executions observed.
-
Unrealized Profit
Say, in last
Tseconds, we observed following transctions (same as the previous example).Product Taker's Side Quantity Strike Price Transaction Price Transaction Time Future Buy 10 --- 19,900 10:00 Mini Future Sell 10 --- 20,100 11:00 Call option Buy 10 20,000 500 10:30 Put option Sell 10 20,000 300 10:25 Unrealized gains at given best bid/ask is;
Product unrealized gains best bid best ask Future 11,000 21,000 21,100 Mini Future 9,000 21,000 21,100 Call option 10,000 1,500 1,700 Put option 10,000 100 200 -
Unrealized Profit (Un-Weigted by Volume)
Say, in last
Tseconds, we observed following transactions (same as the previous example).Product Taker's Side Quantity Strike Price Transaction Price Transaction Time Future Buy 10 --- 19,900 10:00 Mini Future Sell 10 --- 20,100 11:00 Call option Buy 10 20,000 500 10:30 Put option Sell 10 20,000 300 10:25 Unrealized gains at given best bid/ask is;
Product unrealized gains best bid best ask Future 1,100 21,000 21,100 Mini Future 900 21,000 21,100 Call option 1,000 1,500 1,700 Put option 1,000 100 200
Result
I calculated the summary statistics of each variables after grouping each data points by it's signal. Data is normalized by,
-
converting each data point into percentile changes of it's previous data.
e.g.
after original data 0 nan 10 1 0.1 11 2 -0.181818 9 -
removing outliers
Any data point that is not between 1% ~ 99% percentile is filtered.
-
removing data points that did not change
There were many data point which did not change from the previous value. Any data point that is
0is removed.
To sum up, I can say the following for each variable;
- Skew, Kurtosis
- For most variables, Skew of Timeout group is somewhere around 0, while skew of Buy/Sell group shows more variance.
- Mean, Variance, 1st percentile and 99th percentile
- Buy/Sell group tends to be close to 0
- Some Timeout groups have larger/smaller value
- Product Difference
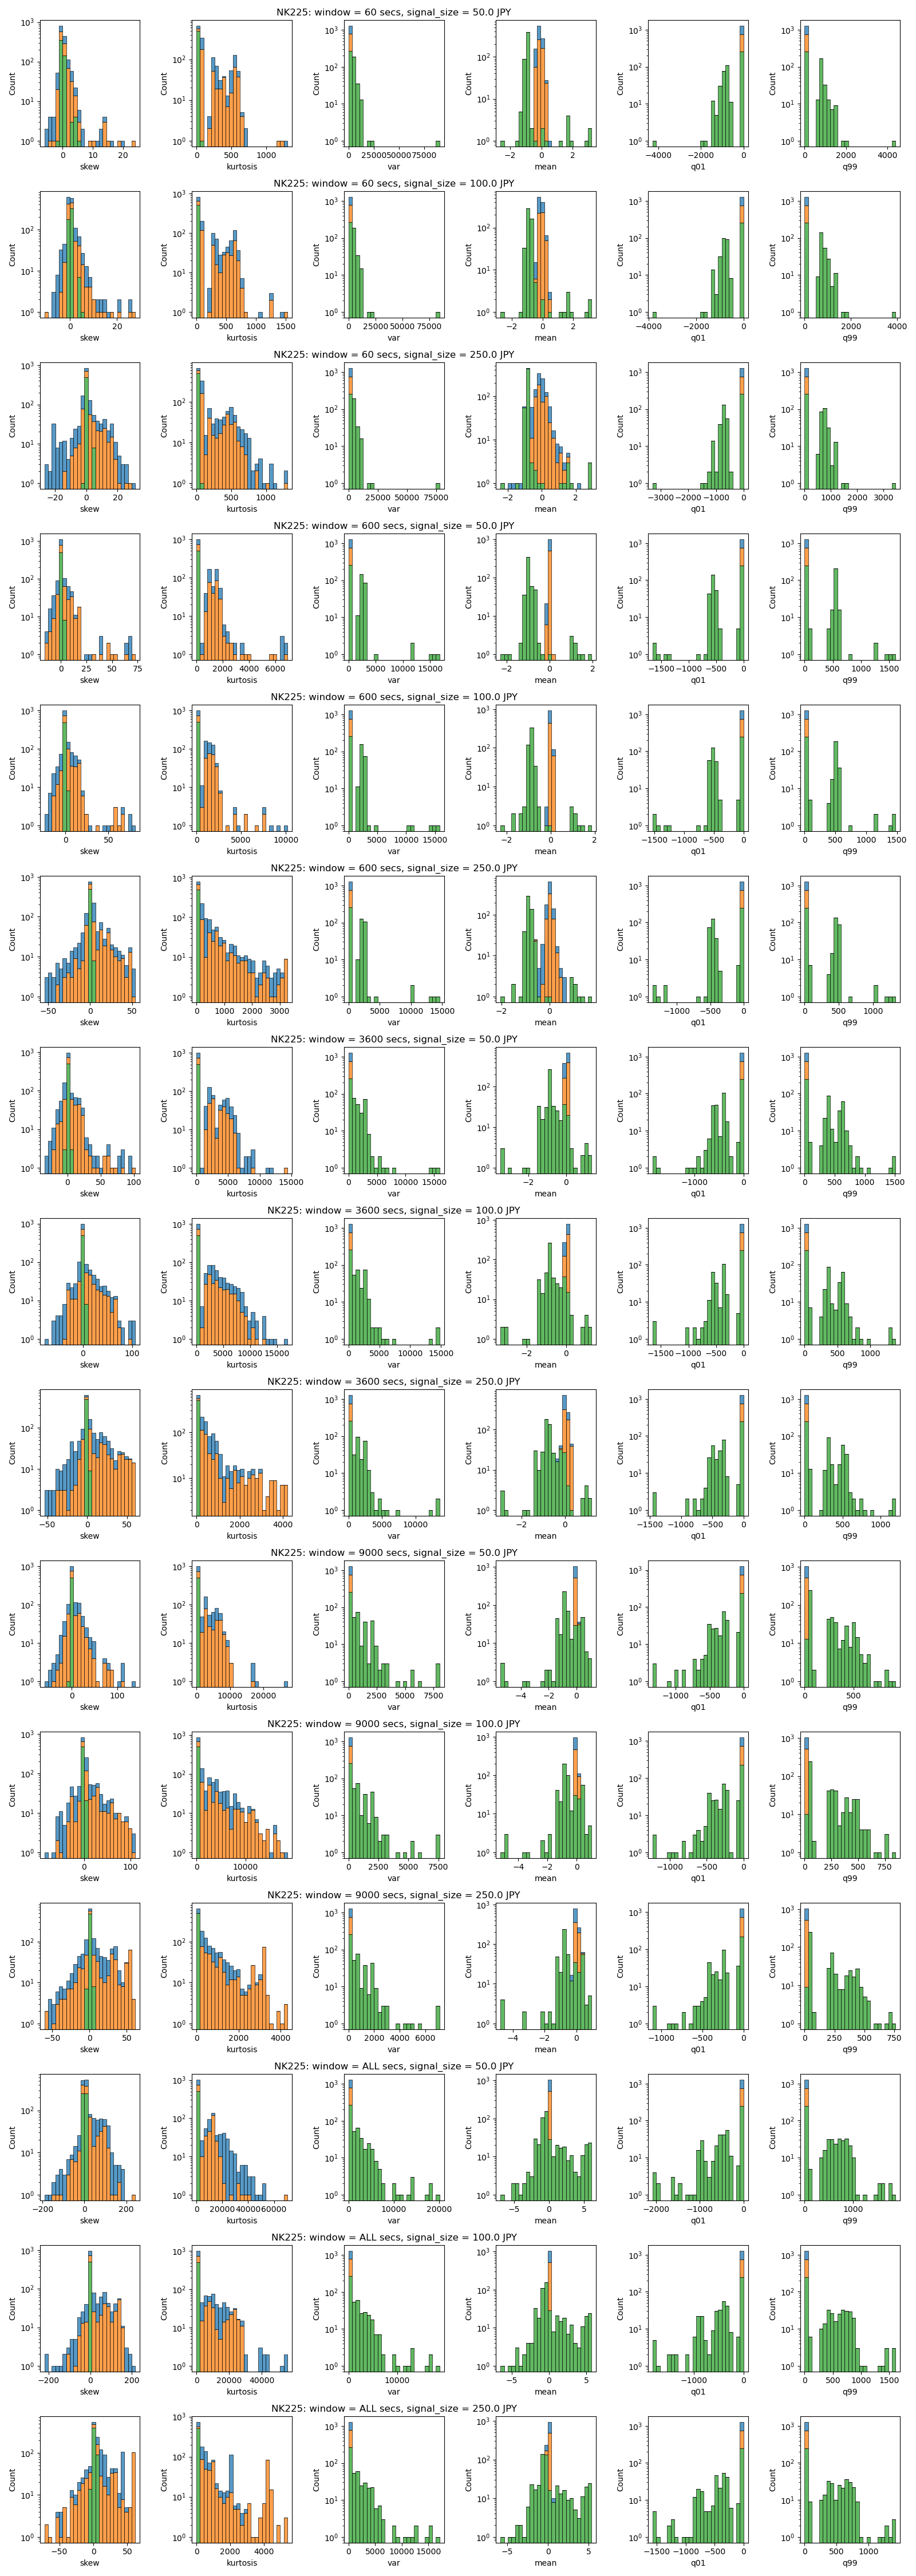
- NK225
Compared to other products, Buy/Sell and Timeout has less overlap.
It can be said that this is coming from it's Japan's most active options market. - JGBL
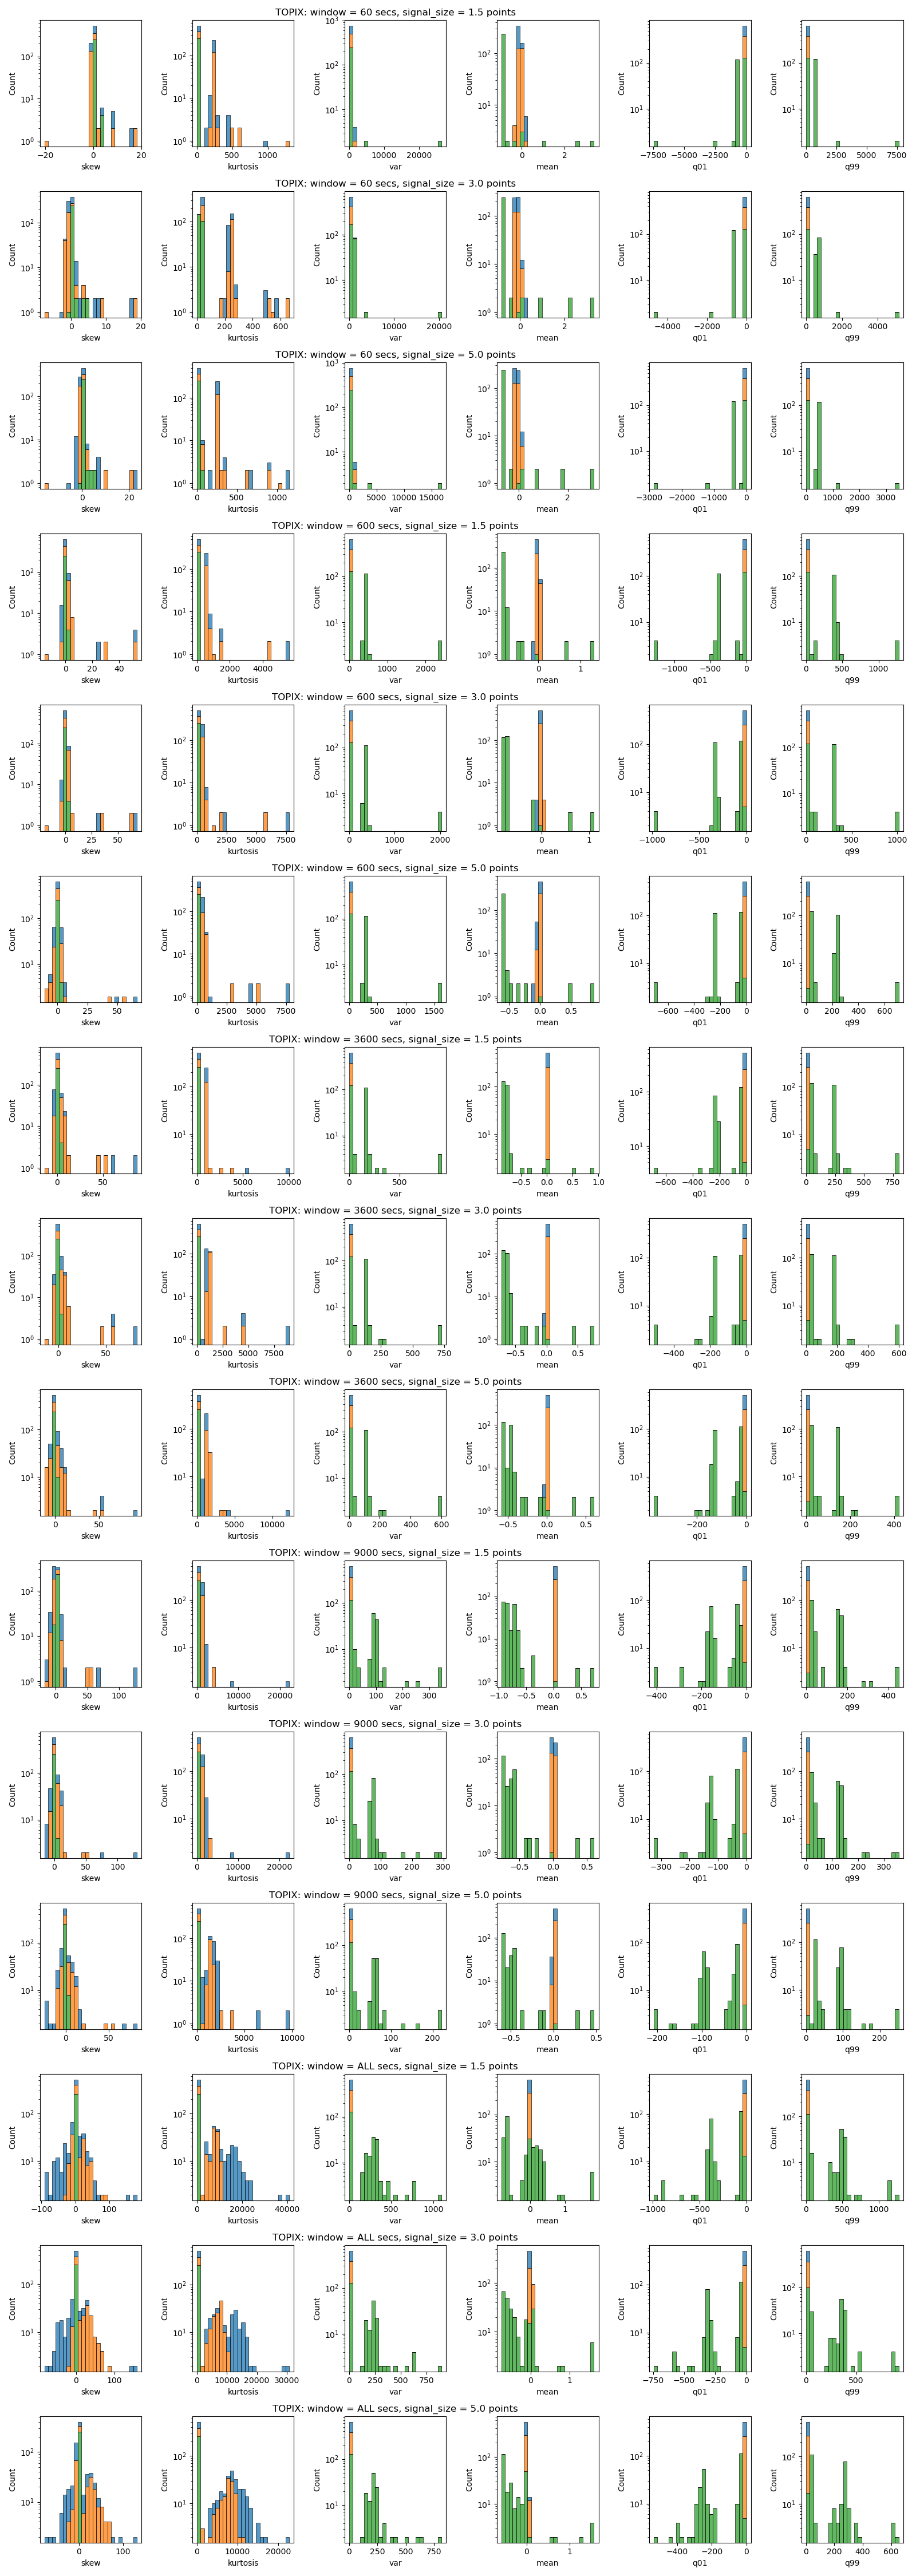
Overlap between Timeout group and others are more significant on JGBL, I'm suspecting that this is due to the smaller number of taker orders. - TOPIX
TOPIX's variable looks less scattered, this is coming from the lack of activity in it's options space.
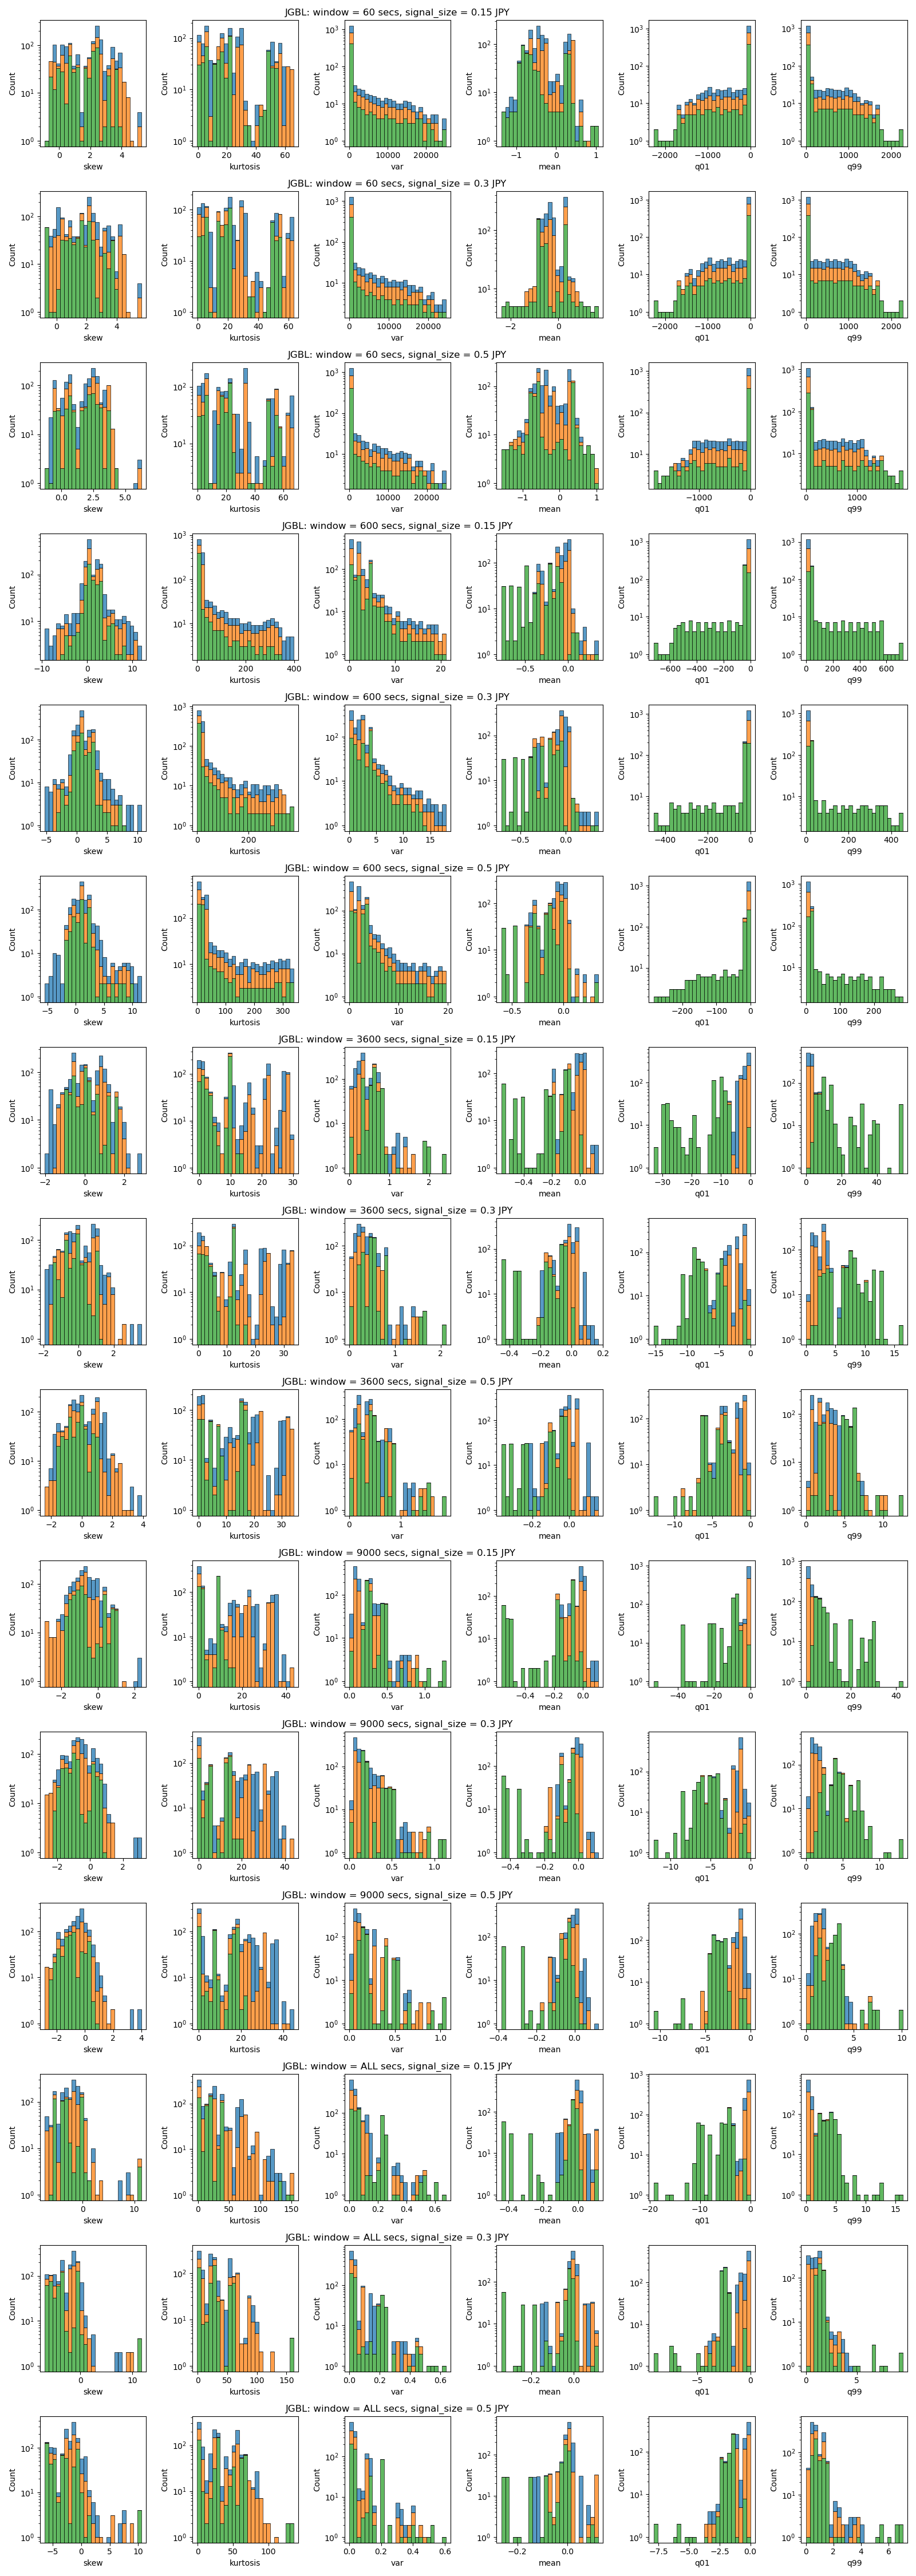
Option related variables are removed.
- NK225
Here is a plot that shows the aggregate of statistical summary of the data for each product.
From left we have skew, kurtosis, variance, mean, 1% percentile and 99% percentile of the data.
The title tells you the parameter. For example, the first row says "NK225: window = 60 secs, signal_size = 50.0 JPY". This means, the plot uses Nikkei 225 future data, with window size of 60 seconds, and signal size of 50 JPY.
Visualization of Statistical Summary
Nikkei Future
TOPIX Future
JGBL Future